NTT Town Page announces the results of a survey on "confectionery stores (Western confectionery)". Based on the yellow pages database, it introduces the characteristics of prefectures and regions where the percentage of pastry shops is high.
In terms of the number of pastry shops registered per 100,000 population, Toyama Prefecture ranked first with 16.64. The prefecture has been competing for the top spot in this category for 10 years. One of the reasons for this is NTT Townpage, which cites the prefectural character of valuing family and socializing and spending money on souvenirs and gifts.
\" registrations (2016) * Per population of approximately 100,000")
Prefecture ranking based on the number of "confectionery stores (Western confectionery)" registrations (2016) * Per population of approximately 100,000
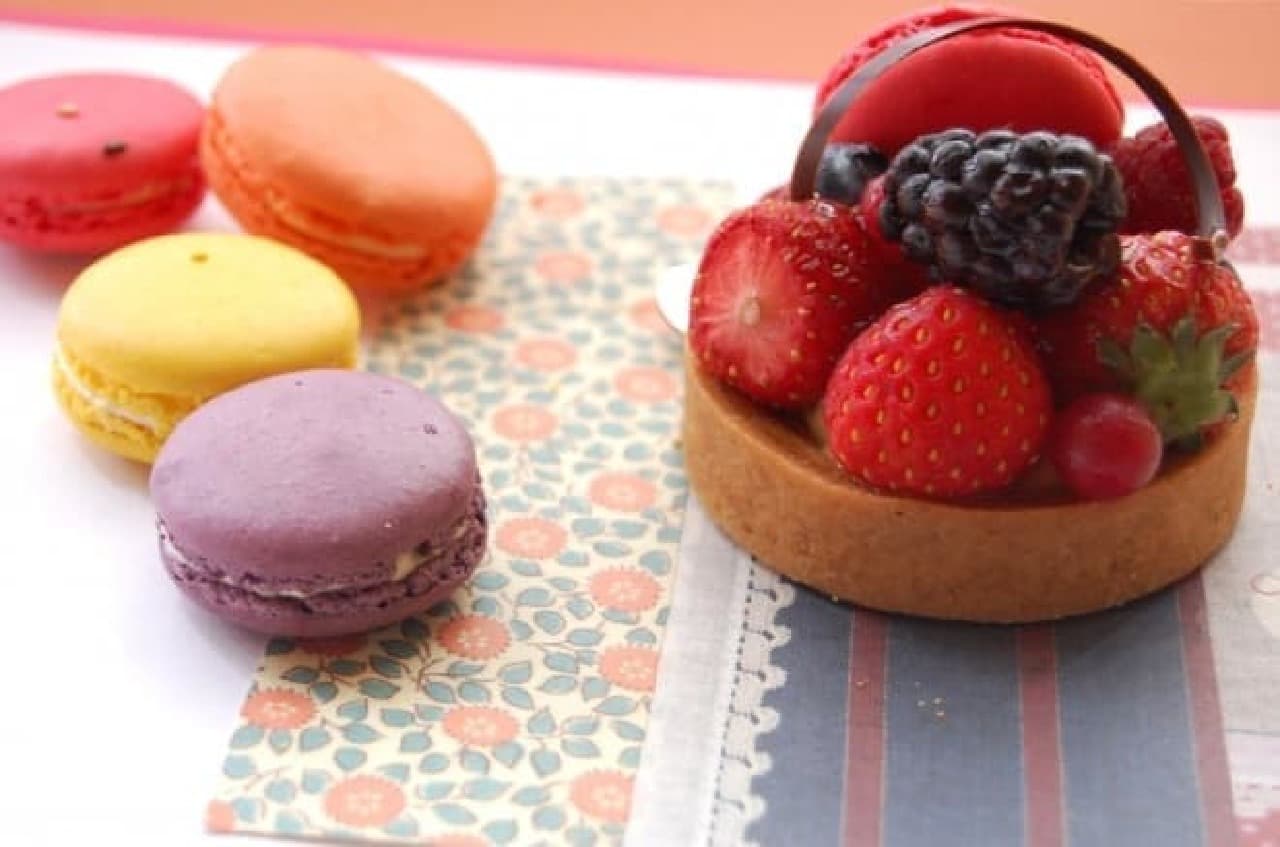
The second place is Nagasaki prefecture with 15.95 cases. The prefecture consumes a particularly large amount of castella, which is about six times the national average. The Western confectionery culture has been nurtured because it used to be an “overseas window”, and around Nagasaki City, there are also regional cakes called “sheath cream” with custard cream sandwiched between sponge dough.

Cake "Sheath cream" sold around Nagasaki City The photo is a product of Baigetsudo
Fukui Prefecture ranked third with 11.59 cases. The prefecture ranked second in ice cream and sorbet consumption in 2012 and third in yokan consumption, and is said to be a "sweet party regardless of Japanese or Western".
Looking at the changes in the purchase price of Western confectionery by item using data from the Ministry of Internal Affairs and Communications, it can be seen that castella is flat and cakes are slightly decreasing. On the other hand, Western confectionery such as cream puffs, tarts, and waffles have increased significantly since around 2006, and the total consumption of Western confectionery is increasing.
")
Changes in the amount of confectionery purchased by type (2000-2015)
![[To buy snacks, Ochanomizu] Two places where you can buy heart-warming "old-fashioned Western confectionery"](https://image.enuchi.jp/upload/articles/4533/c9c7e30158cc9f1e5db8df403fc4dfd8_special.jpg)
![LUSH releases new album "Collaboration Shimasu 3" on April 21 with rhyming ensemble [Monyu Sode] and a variety of guests, featuring a rich variety of songs by a wide range of artists.](https://image.enuchi.jp/upload/articles/14221/7028dd2a3fa9a2bec15a85fbf3924b56_special.jpg)

![Convenience store petit-price cosmetics] AND by ROM AND "Mellow Stick Blush" and "Glassy Milky Tone Up" at LAWSON.](https://image.enuchi.jp/upload/articles/14192/eca9c3cd72c87b0c6ae58c7c3d48661f_related.jpg)